
TOPIC 1.1.3
Demand, supply and market equilibrium
On this page
Demand
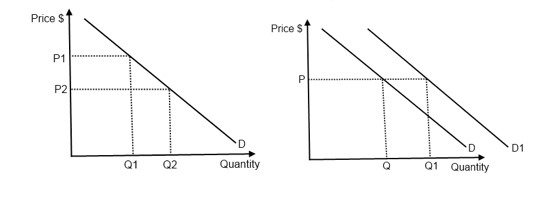
a) Definition of demand.
Definition: Demand is the willingness and ability to purchase a good or service at a given price over a period of time.
b) The use of a demand curve diagram to show:
Changes in price causing movements along a demand curve
Shifts indicating increased and decreased demand.
c) Factors that may cause a shift in the demand curve:
Advertising
Income
Fashion and tastes
Price of substitute goods
Price of complementary goods
Demographic changes.
Supply
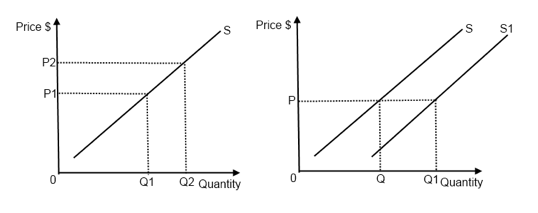
d) Definition of supply.
Definition: Supply is the willingness and ability to sell a good or service at a given price over a period of time.
e) The use of supply curve diagram to show:
Changes in price causing movements along a supply curve
Shifts indicating increased and decreased supply.
Market Equilibrium
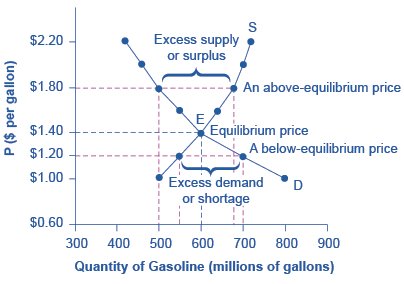
g) Equilibrium price and quantity and how they are determined.
Definition: Equilibrium price is the price at which quantity supply and quantity demanded are equal.
Definition: Equilibrium quantity is the amount bought and sold in the market at the equilibrium price.
Equilibrium is determined at the point where the demand and supply curves intersect in a market.
h) The use of diagrams to show:
How shifts in supply and demand affect equilibrium price and quantity in real-world situations
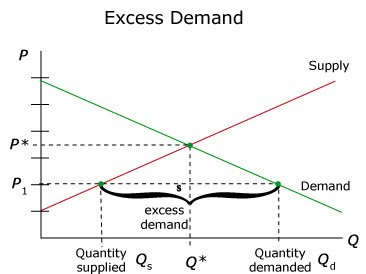
Excess demand
Excess supply
i) Define, calculate and draw excess demand and excess supply.
Excess Demand (Shortage)
Definition: Excess demand is when quantity demanded exceeds quantity supplied at a given price.
Formula: Excess Demand = Quantity Demanded - Quantity Supplied
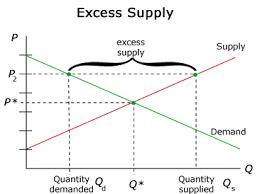
Excess Supply (Surplus)
Definition: Excess supply is when quantity supplied exceeds quantity demanded at a given price.
Formula: Excess Supply = Quantity Supplied - Quantity Demanded
j) The use of market forces to remove excess supply or excess demand.
Excess Demand: Sellers raise prices, decreasing demand and increasing supply to re-establish equilibrium.
Excess Supply: Producers reduce prices, increasing demand and decreasing supply until equilibrium is restored.
Movement:
Movement:
Shift:
Shift: